
Figure 2.
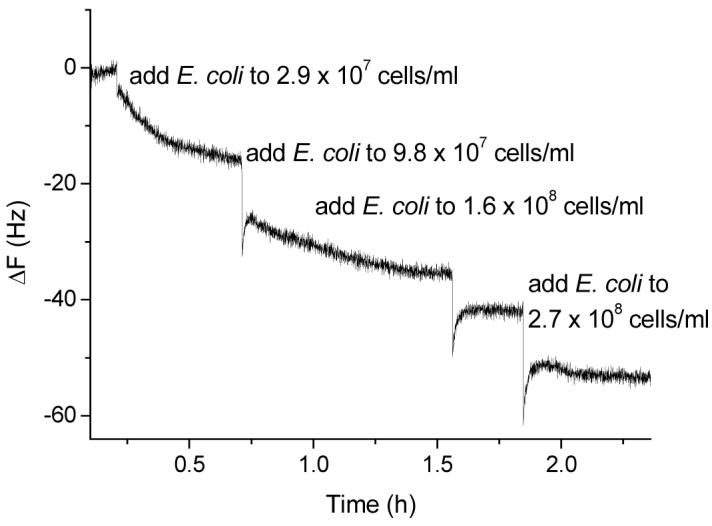
Frequency change vs. time curve when the mannose-QCM electrode was exposed to different concentrations of E. coli W1485 in 1.0 mL stirred PBS buffer (pH = 7.2) with 1mM Ca2+ and 1 mM Mn2+.. (The final concentrations of E. coli were: 2.9 × 10⁷, 9.8 × 10⁷, 1.6 × 10⁸, and 2.7 × 10⁶ cells/mL.)