
Figure 4.
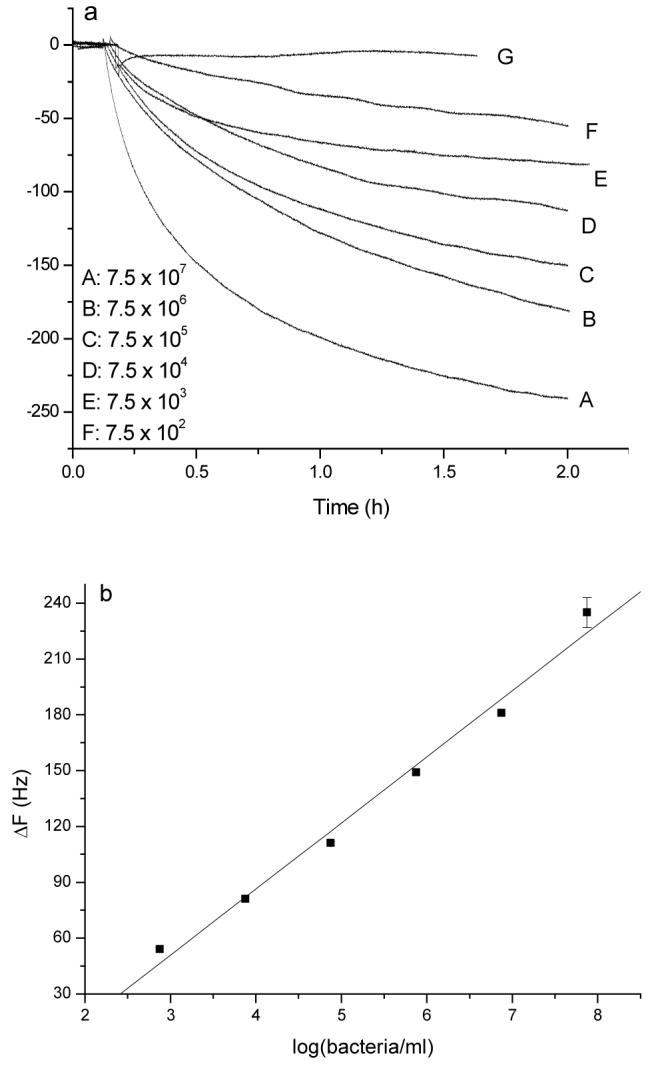
(a) Frequency change vs. time curve when mannose-QCM electrodes were exposed to different concentrations of E. coli W1485 from 7.5 × 10² to 7.5 × 10⁷ cells/mL in 1 mL stirred PBS with 1 mM Mn2+ and 1 mM Ca2+ and 100 nM Con A.Curve G: the addition of blank solution (50 μL culture medium without E. coli) (The mannose-QCM was first exposed to 100 nM Con A solution for about 2 h); (b) Calibration curve: frequency shift vs. log of E. coli concentration.