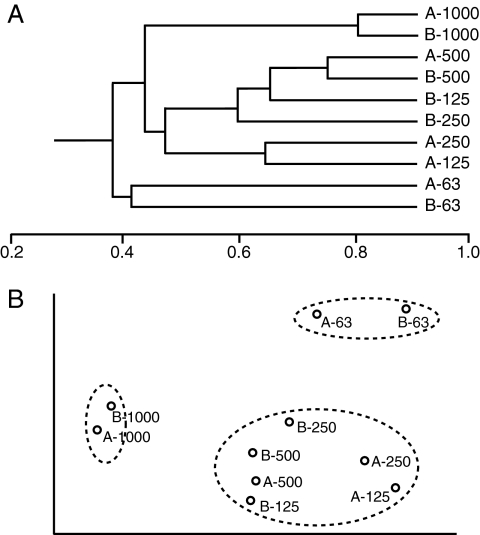
FIG. 1.
Multivariate plots based on Jaccard similarities of bacterial communities on different sizes of stream sediment particles as determined from DGGE profiles. Samples were taken on two dates (indicated by the prefixes A [12 February 2007] and B [21 March 2007]) and from five size ranges of particles: 63 to 125 μm (63), 125 to 250 μm (125), 250 to 500 μm (250), 500 to 1,000 μm (500), and 1,000 to 2,000 μm (1000). (A) Cluster analysis based on the unweighted pair group method with average means. The scale indicates the Jaccard similarity scores. (B) Nonmetric multidimensional scaling plot (three dimensions, stress 0.05; the first two dimensions are shown) with circles indicating groups of samples.

