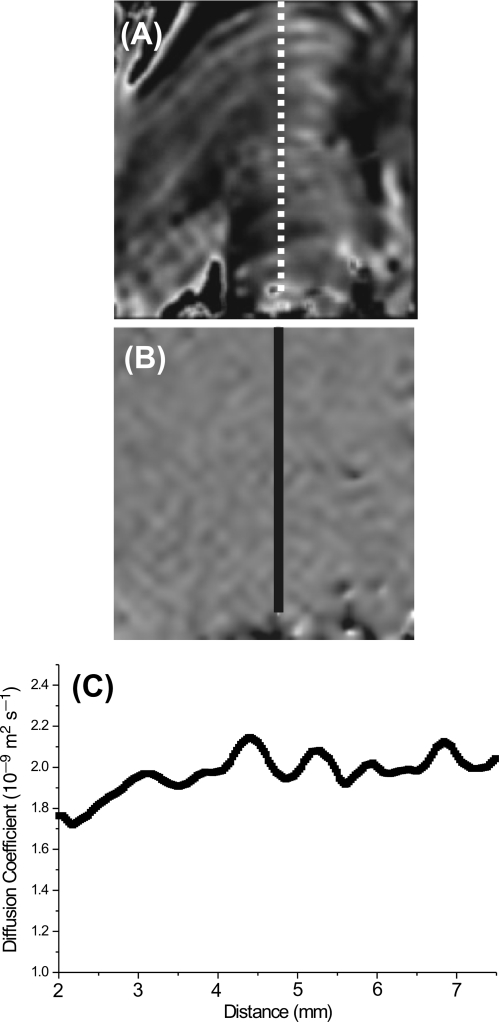
FIG. 4.
Examples of a water diffusion map and profiles. (A) MR slice showing the biofilm structure (the area taken from the slice shown in Fig. 2J). (B) Corresponding relative water diffusion coefficient map. The differences in contrast reflect differences in water diffusion coefficients. (C) Profile of actual water diffusion coefficients along the transect shown in panels A and B. Overall, little variation in the water diffusion coefficient was observed. The scale of the line of transects in panels A and B is 7.5 mm long.

