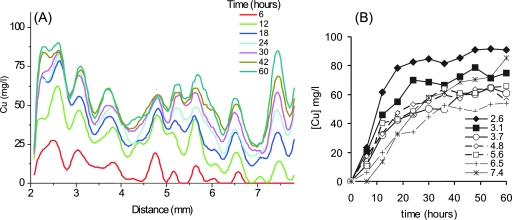
FIG. 7.
(A) Calibrated copper concentrations at 0 to 60 h along the transect shown by the white line in Fig. 6E. (B) Cu concentration-versus-time plot for depths (depths are shown in mm) along the transect shown in panel A. For consistency, all plots in panel B were selected from depths which exhibited peaks in panel A.

