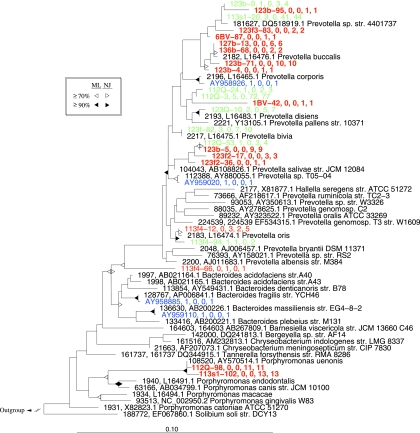
FIG. 4.
Phylogenetic relationships among representative taxa belonging to the phylum Bacteroidetes. The tree was reconstructed using the maximum-likelihood method in ARB with a 75% similarity column filter. Representative taxa were defined using a 97% OTU definition, as described in the text. Additional taxa represent a nonredundant list of nearest neighbors current as of April 2008. Taxa in red represent OTUs unique to our sequencing efforts, OTUs in green were common to our study and at least one other, and OTUs shown in blue were detected in other studies but not encountered in our sequencing. The numbers after each OTU indicate the number of sequences with unknown BV status, the number of sequences from subjects without BV, the number of sequences from subjects with BV, and the total number of sequences within each OTU. OTUs shown in boldface were found only in subjects with BV. Triangles at nodes represent bootstrap values from 100 resamplings of maximum-likelihood (ML) trees built in PHYLIP and neighbor-joining (NJ) trees, as shown in the legend and described in the text. str., strain.

