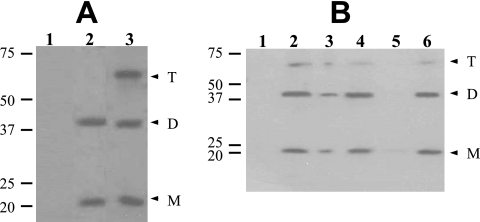
FIG. 2.
Detection and localization of GerD-FLAG in spores. (A) Dormant spores of strains PS832 (wild type), PP17 (gerD amyE::gerD-flag), and PP19 (gerD amyE::PsspB-gerD-flag) were disrupted and extracted, aliquots of the total extracts were run by SDS-PAGE, proteins were transferred to a PVDF membrane, and GerD-FLAG was detected with anti-FLAG antibody as described in Materials and Methods. Samples run in the various lanes were from spores of PS832 (1), PP17 (2), and PP19 (3). The numbered lines to the left of the figure denote the migration positions of molecular mass markers, in kDa, and the arrowheads on the right indicate the predicted migration positions of GerD-FLAG monomers (M), dimers (D), and trimers (T). Twice as much extract from PP17 spores was run as the amount of extract from PS832 and PP19 spores. Note that although aliquots with twice the amount of extract from spores of strain PP17 were run in this experiment, the bands from the strains appear to exhibit approximately the same intensity. However, in this experiment, the amount of extract analyzed was very high, probably saturating the assay. (B) Localization of GerD-FLAG in spores. Spores of strain PP19 (gerD amyE::PsspB-gerD-flag) were disrupted, extracted, and fractionated, aliquots of fractions from equal amounts of spores were run by SDS-PAGE, proteins were transferred to a PVDF membrane, and GerD-FLAG was detected as described in Materials and Methods. Samples run in the various lanes were from the following fractions: 1, coat/outer membrane; 2, total extract; 3, insoluble; 4, soluble; 5, S100; and 6, P100. The numbered lines to the left of the figure denote the migration positions of molecular mass markers, in kDa, and the arrowheads on the right indicate the predicted migration positions of GerD-FLAG monomers (M), dimers (D), and trimers (T).

