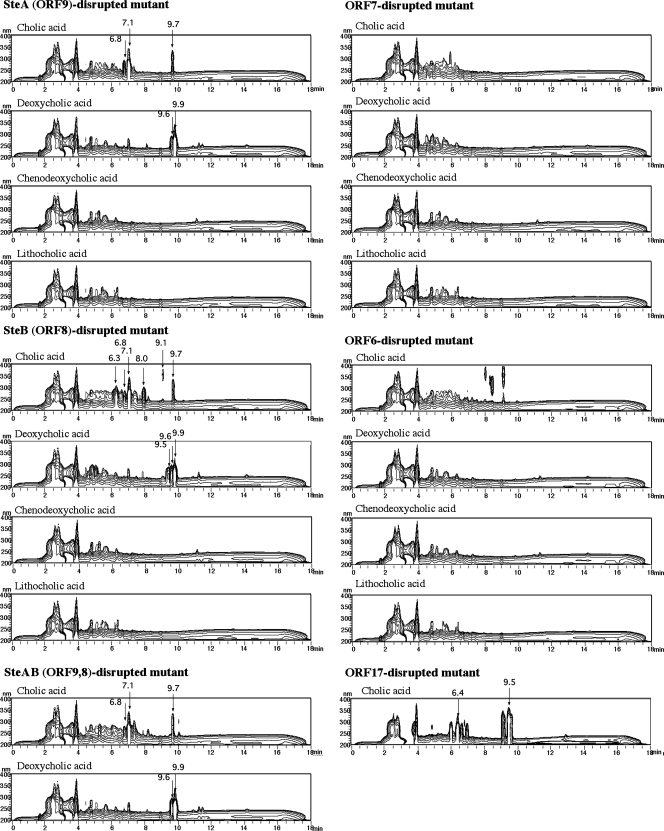
FIG. 4.
Three-dimensional HPLC analysis of cultures of the ORF9 disruption mutant (ORF9−), the ORF8 disruption mutant (ORF8−), the ORF7 disruption mutant (ORF7−), the ORF6 disruption mutant (ORF6−), the ORF9 and ORF8 disruption mutant (ORF9,8−), and the ORF17 disruption mutant (ORF17−) incubated in 1/2 LB + 1/2 C medium with 0.1% (wt/vol) cholic acid, deoxycholic acid, chenodeoxycholic acid, and lithocholic acid for 3 days. The vertical axis indicates wavelength (nanometers), and the horizontal axis indicates RT; the UV absorbance of each compound is represented in contours. Possible intermediate compounds are indicated by arrows. The values above the arrows are RTs.

