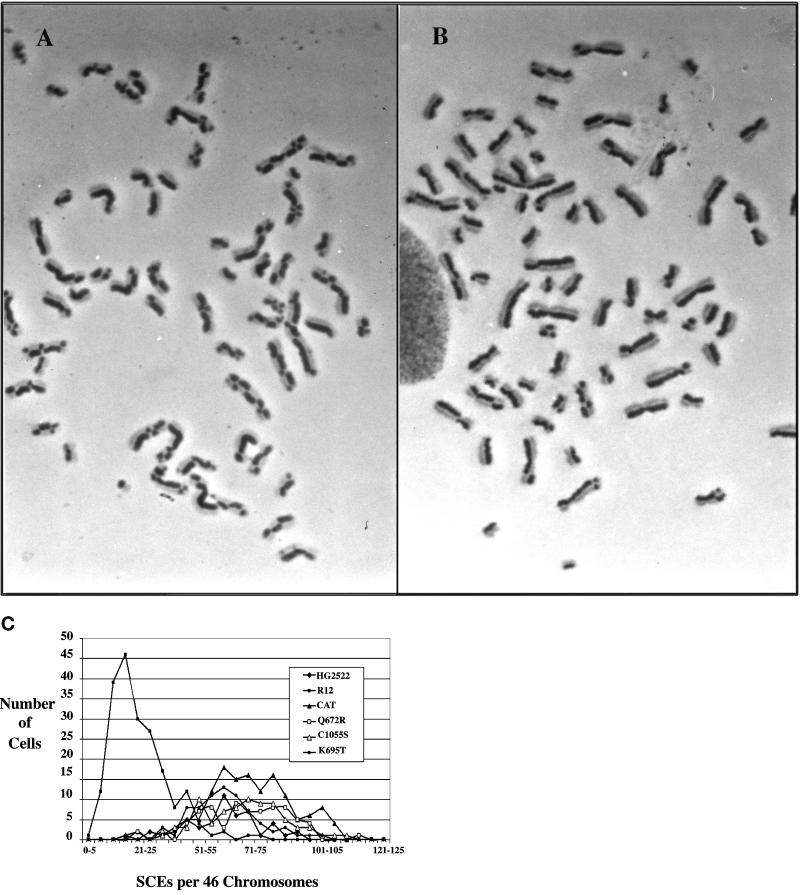
Figure 1.
SCE assay. (A) Metaphase chromosomes from SV40-transformed BS fibroblast cell line HG2522 differentially stained to show the high frequency of SCEs. (B) Metaphase chromosomes from SV40-transformed BS fibroblast cell line HG2522 transfected with the normal BLM cDNA. (C) A graphic display of the range and distribution of SCEs in the fibroblast cell lines transfected with cDNAs encoding normal and missense BLM proteins. The mean number of SCEs per 46 chromosomes and range are as follows: HG2522 (55 and 16–88); CAT (55 and 18–105); R12 [WT] (24 and 5–74); Q672R (71 and 38–104); K695T (59 and 33–98); and C1055S (67 and 39–100). The values reported for cell line HG2522 and for the R12-transfected line represent experimental baseline numbers for these cell lines. At least 25 metaphases were counted for each transfected cell line.

