FIG. 1.
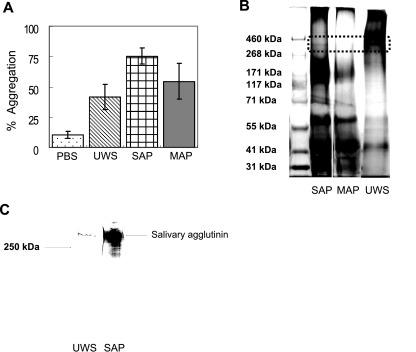
(A) Bacterial aggregation profiles of S. mutans UA159. SAP and MAP were prepared from S. mutans NG8, and 100 μl of UWS, SAP, or MAP was added to 900 μl of bacterial suspensions. Aggregation was calculated as the percent reduction in OD after 120 min relative to that of the initial cell suspension. Aggregation data were repeated at least five times, and error bars represent standard deviations. There were statistically significant differences in bacterial aggregation capacity among salivary preparations (SAP > MAP > UWS > PBS; P < 0.01). (B) Tris-acetate gel (3 to 8%) electrophoresis of high-molecular-weight markers (lane 1), SAP (lane 2), MAP (lane 3), and UWS (lane 4). Following electrophoresis, proteins were stained with both a glycoprotein detection kit and a silver-staining kit. The dotted rectangle indicates the position of salivary agglutinin migration, which stains as a band of approximately 340 kDa in UWS and SAP but is absent in MAP. (C) Western blot analysis of UWS (lane 1) and SAP (lane 2) using an antibody to gp340 (Affinity BioReagents, Golden, CO).

