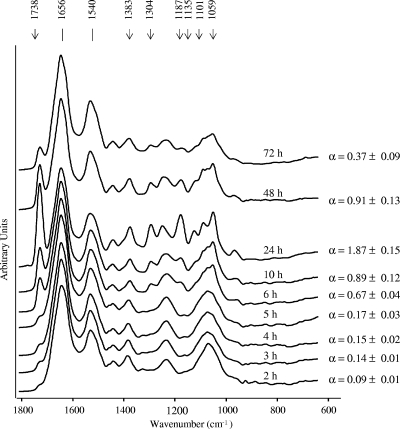
FIG. 2.
FTIR spectra (in the region from 1,800 to 600 cm−1) obtained during the growth of a B. cenocepacia clinical isolate as an example of the kinetics of PHB production of a nonfermentative rod growing on TSA medium at 37°C. The semiquantitative estimation of the PHB content, calculated from α (I1,738/I1,540) values, is indicated at each time of growth. The α values were calculated as the ratio of the I1,738 of the ester carbonyl peak, used as a PHB marker band, and the I1,540 of the amide II peak, used as an internal standard of the total biomass (37).

