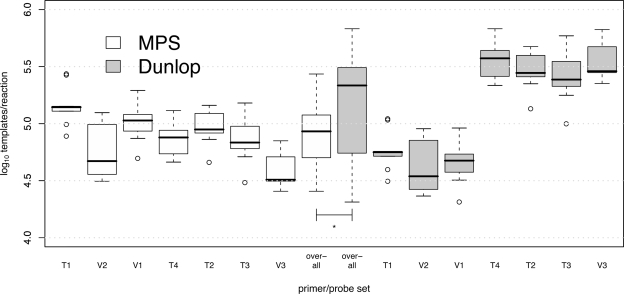
FIG. 2.
Measurement of positive control with each primer/probe set. Each box plot labeled with the name of a primer/probe set represents the distribution of the averages of each set of duplicate reactions in each of nine PCR experiments. Box plots labeled “overall” show the overall distribution of values pooled from all seven assays. The values were calculated using standard curves constructed using either MPS or the Dunlop plasmid. The black horizontal bar, box, whiskers, and open circles indicate the median, interquartile range (IQR), points 1.5 × IQR beyond the first and third quartiles, and outliers, respectively. The asterisk indicates that the overall variance for pooled data from all assays differed significantly, depending on the reference material used in the calculation (P < 0.0001).

