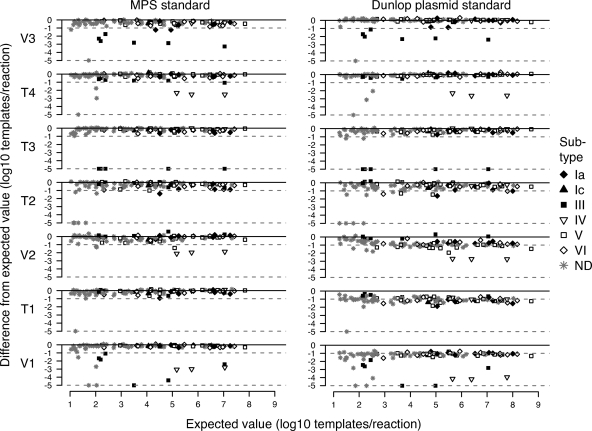
FIG. 4.
Deviation of viral loads from expected values using each primer/probe set, calculated using MPS (left) and Dunlop (right) as references. The expected value of each specimen (x axis) is plotted against the difference between the expected value and the value obtained in each assay (y axis). Only the 98 specimens with expected values of >10 templates/reaction are shown. Negative specimens and those with deviations from expected values of >5 log10 templates/reaction are plotted on the dotted line at the base of each plot. Specimens with an undetermined subtype (ND) are plotted in gray.

