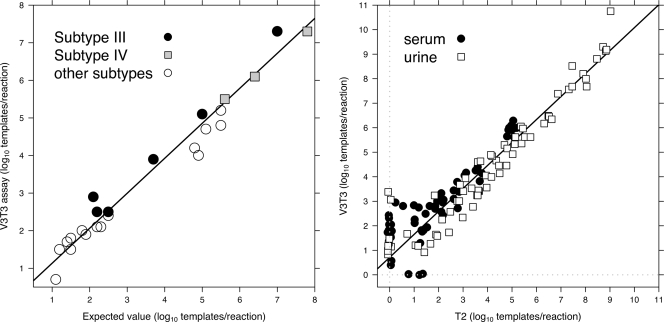
FIG. 5.
(Left) Comparison of expected values versus concentrations calculated using the V3T3 assay for specimens defined as discrepant. Subtype III and IV specimens are highlighted as indicated in the legend. (Right) Comparison of the T2 and V3T3 assays for 230 consecutive clinical specimens. Only specimens with a CT of <45 cycles for at least one of the two assays appear in the plot (60/96 and 69/134 serum and urine specimens, respectively); those with a CT of ≥45 were assigned a value of zero and are shown slightly offset from the origin of each axis (gray dotted line) to avoid overplotting. The regression line was calculated after excluding points that failed to amplify within 45 cycles in either of the two assays.

