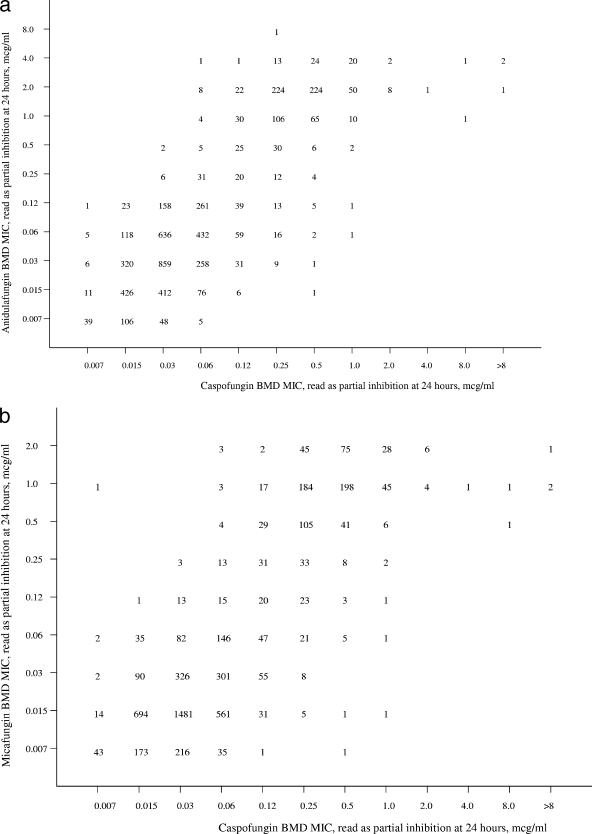
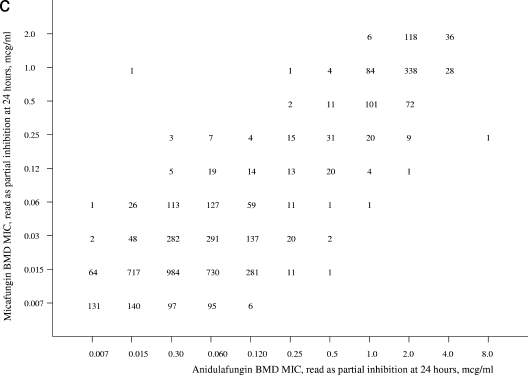
FIG. 1.
Scatterplots of anidulafungin (a) and micafungin (b) versus caspofungin MICs and of anidulafungin versus micafungin (c) MICs for 5,346 isolates of Candida spp. Excellent correlations were observed for all three comparisons (r = 0.85, 0.84, and 0.89, respectively). MICs were determined for each drug using RPMI 1640 medium, a 24-h incubation, and a partial-inhibition (≥50%) endpoint.


