FIG. 2.
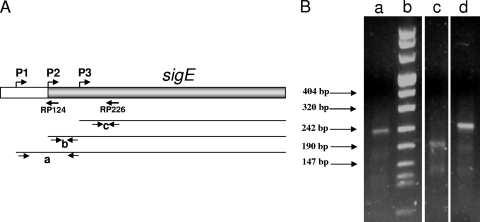
sigE promoters characterization. (A) Map of the sigE region. The sigE open reading frame is shown in gray, and the positions of the transcription start points of the three promoters (P1, P2, and P3) as well as of the two primers used for reverse transcription in the 5′ RACE experiments (RP124 and RP226) are shown. The three thin lines represent the transcripts originating from each of the three promoters. Arrow pairs below each transcript indicate the primer couples used in quantitative RT-PCR experiments. Couple “a” detects only transcripts originating from P1, couple “b” detects transcripts from P1 and P2, and couple “c” detects transcripts originating from all promoters. (B) Gel electrophoresis of the amplicons obtained by 5′ RACE (reverse transcription from RT226) from unstressed cells (lane a), cells subjected to diamide-induced oxidative stress (lane c), and cells subjected to SDS-induced surface stress (lane d). The molecular weight marker (marker 8; Roche) is shown in lane b.

