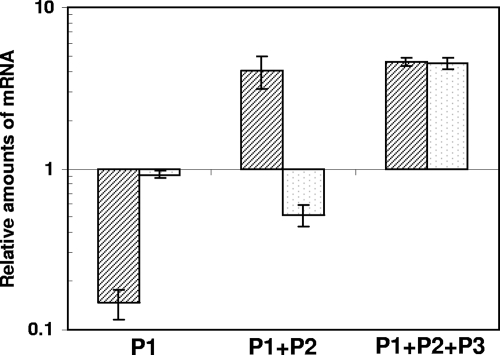
FIG. 4.
Changes in sigma factor mRNA levels after exposure to SDS-induced surface stress (black stripes) or diamide-induced oxidative stress (gray dots). Three different primer couples were used to evaluate the variation of transcripts initiated at P1, P1, and P2, or from all of the three promoters (P1+P2+P3) (Fig. 1A). Values are expressed as the ratio between the number of cDNA copies detected in samples obtained from the stressed cultures and the number of cDNA copies detected in samples obtained from unstressed bacteria. The values were normalized to the level of sigA cDNA, which represented the internal invariant control.

