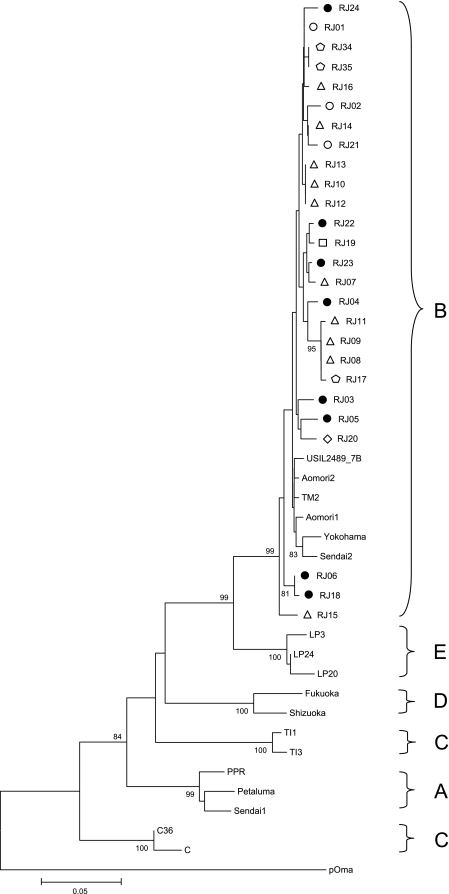
FIG. 1.
Phylogenetic tree from 362 nucleotides of CA gag alignment. The tree was inferred using the neighbor-joining distance method and Kimura's two-parameter model. Shown are bootstrap values of 1,000 replicates. Bootstrap values greater than 70% are shown. Circles represent isolates from location A (black circles represent cats undergoing treatment), pentagons represent isolates from location B, triangles represent isolates from location C, lozenges represent isolates from location D, and squares represent isolates from location E. The horizontal bar indicates the nucleotide substitution scale.

