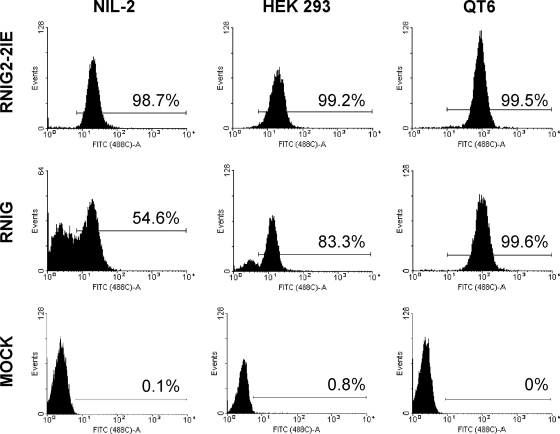
FIG. 2.
FACS analysis of GFP expression from modified and unmodified vector LTRs. NIL-2, HEK 293, and QT6 cell lines transduced with RNIG and RNIG2-2IE vectors were selected with G418 and FACS analyzed 57 days after G418 removal. One clone from each cell line with each of the two vectors is shown. In histograms, the relative GFP fluorescence is plotted against the cell count, and the range of GFP-positive cells is indicated with a horizontal bar. As a negative control, the autofluorescence of mock-infected NIL-2, HEK 293, and QT6 cells is shown.

