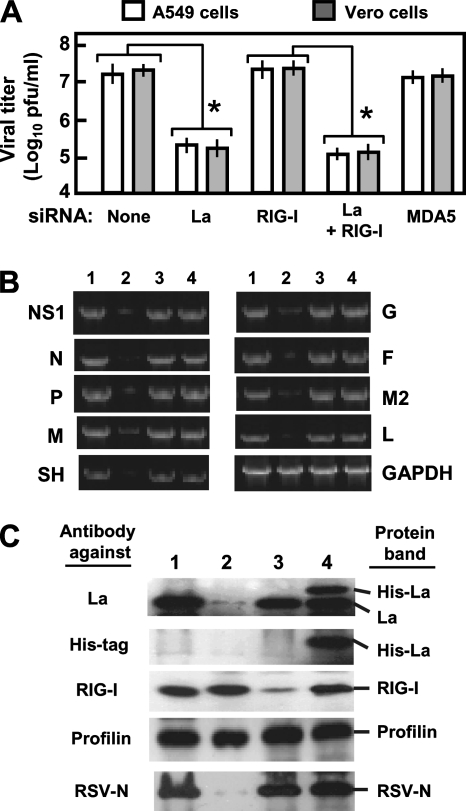
FIG. 4.
La is needed for optimal RSV growth. (A) Progeny viral titer (PFU/ml) in medium collected at 48 h p.i. from RSV-infected A549 and Vero cells in which the indicated genes were knocked down by siRNA (same as in Fig. 3C). An asterisk indicates significant reduction (P < 0.05). (B) Inhibition of RSV transcription in La-silenced cells. A549 cells were transfected with luciferase siRNA (lane 1), La siRNA (lane 2), RIG-I siRNA (lane 3), and plasmid pCAGGS-His-La (lane 4) and infected with RSV 36 h later. Total RNA was isolated after another 12 h and subjected to qRT-PCR as described in Materials and Methods. Transcript levels of RSV genes (NS1, N, P, M, SH, G, F, M2, and L) and control cellular GAPDH were determined by qRT-PCR as described in Materials and Methods. For visual presentation, 10 μl of the PCR was analyzed in a 2% agarose gel and stained with ethidium bromide. For a given gene, samples were taken after the same number of cycles from lanes 1 through 5. However, because of the polarity of viral gene transcription, samples from progressively greater numbers of cycles were taken for more promoter-distal genes so that relatively similar band intensities could be presented for photographic equality. For example, all NS1 samples are shown after 24 cycles, all N samples are shown after 25 cycles, and all P samples are shown after 26 cycles, etc. (C) Western blot of the cell lysates corresponding to the same treatments as above (B) (with the same lane numbers) using the indicated antibodies (left). The detected bands are marked (right). Profilin is an unaffected control.

