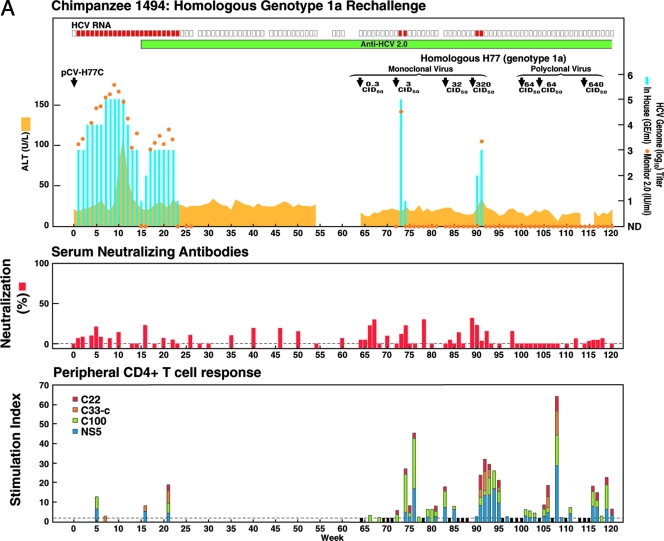
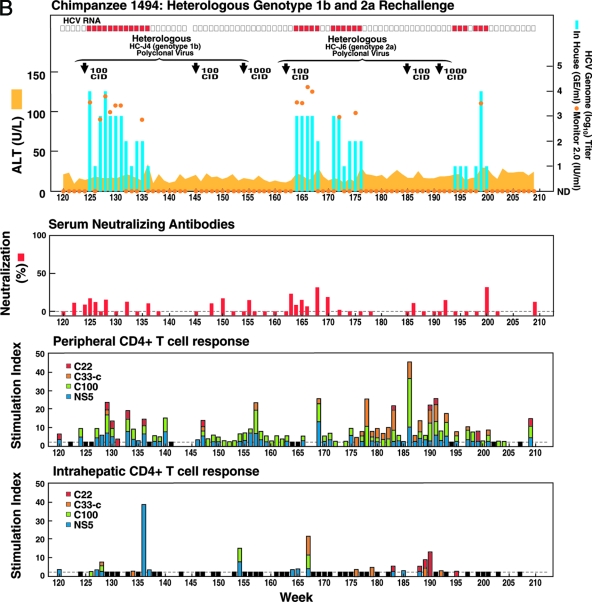
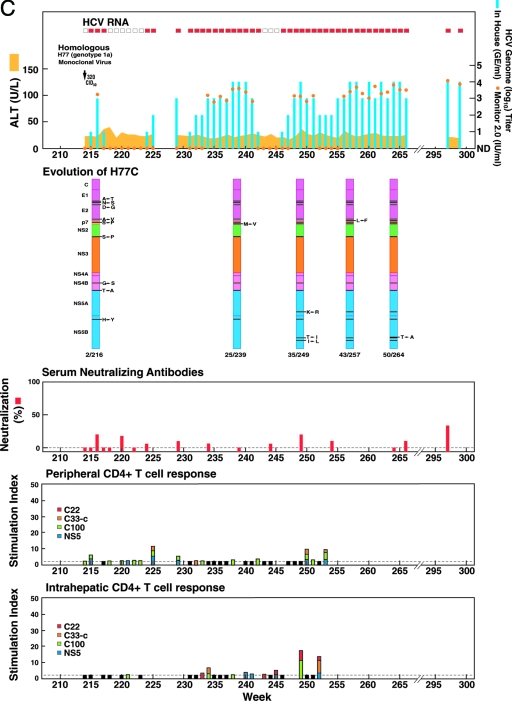
FIG. 1.
Homologous and heterologous rechallenge experiments in CH1494 with resolved monoclonal HCV infection following intrahepatic transfection with RNA transcripts of pCV-H77C (genotype 1a). The CID of viruses used for each rechallenge are indicated. (A) Weeks 0 to 120; about 12 months after viral clearance, CH1494 was rechallenged with homologous monoclonal H77C virus and polyclonal H77 virus. (B) Weeks 120 to 210; heterologous rechallenges with HC-J4 (genotype 1b) and HC-J6 (genotype 2a). (C) Weeks 210 to 300; final challenge with monoclonal H77C, which resulted in persistent infection. The course of infection was evaluated as follows: serum samples collected weekly were tested for HCV RNA by in-house RT-nested PCR with 5′-untranslated region primers and/or with the Roche Monitor Test 2.0. Red rectangle, positive by RT-nested PCR and/or by Monitor; empty rectangle, negative by RT-nested PCR; blue bars, HCV titers determined by performing the RT-nested PCR on 10-fold serial dilutions of extracted RNA; orange dots, HCV Monitor titers. Samples below the detection limit of 600 IU/ml are shown as not detected. Green horizontal bar, seroconversion in the second-generation ELISA; yellow-orange shaded area, serum ALT. For determination of neutralizing antibodies, the percent neutralization of retroviral pseudoparticles bearing the H77C envelope proteins was measured (>50% considered significant). For peripheral and intrahepatic CD4+ T-cell responses, the CD4+ T-cell responses to core (red), NS3 (orange), NS3-NS4 (green), and NS5 (blue) were detected against HCV-1 (genotype 1a) antigens, which are shown according to the specific SI. A specific SI of >2 was considered significant. At the weeks tested, in which the SI was ≤2 against all four antigens, the negative result is indicated by a black bar (with a value of 2). For the evolution of H77C, the H77C genome is shown as a vertical bar with core at the top and NS5B at the bottom. Black lines with capital letters indicate new amino acid changes that were identified when a sequence was compared with the sequence obtained at the previous time point. Solid lines without capital letters represent amino acid changes that persisted. The week analyzed is indicated at the bottom of each genome.


