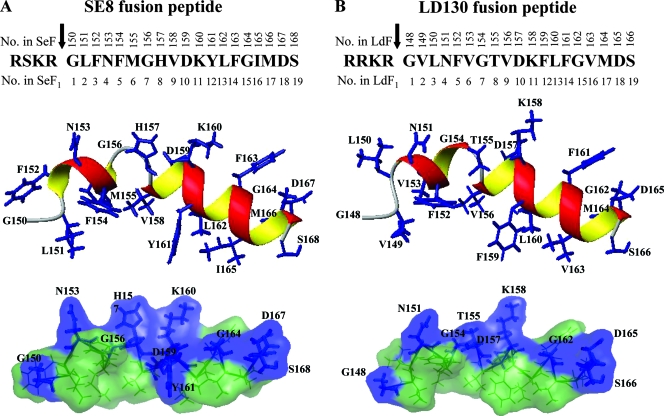
FIG. 10.
Computer-assisted modeling of fusion peptides of SE8 (A) and LD130 (B). The predicted structures of the peptides were modeled on the closest-to-mean NMR structure of the fusion peptide of HaF by replacing relevant amino acids using PyMol, followed by energy minimization in Amber force field using Amber version 8.0. Top panels are the linear sequences of the fusion peptides, with the arrows indicating the furin cleavage sites; numbers above the amino acid sequences indicate the residue positions in full-length SE8 (SeF) or LD130 (LdF); numbers beneath the amino acid sequences indicate the residue positions in F1 fragments of SE8 (SeF1) or LD130 (LdF1) starting from the first amino acid of the fusion peptide. Middle panels are ribbon representations, and bottom panels are surface representations with the same color code used in Fig. 9.

