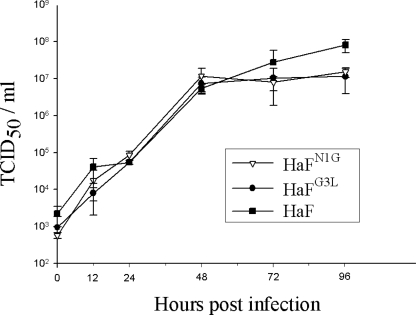
FIG. 5.
One-step growth curves of recombinant and control viruses. HzAM1 cells were infected at an MOI of 5 TCID50 U/cell with vHaBacΔF-HaFN1G, vHaBacΔF-HaFG3L, and vHaBacΔF-HaF. Cell-free medium was harvested at various times p.i., and the titers of progeny virus were determined by an endpoint dilution assay. Data points represent mean titrations from triplicate infections, and error bars represent standard deviation from the means.

