FIG. 3.
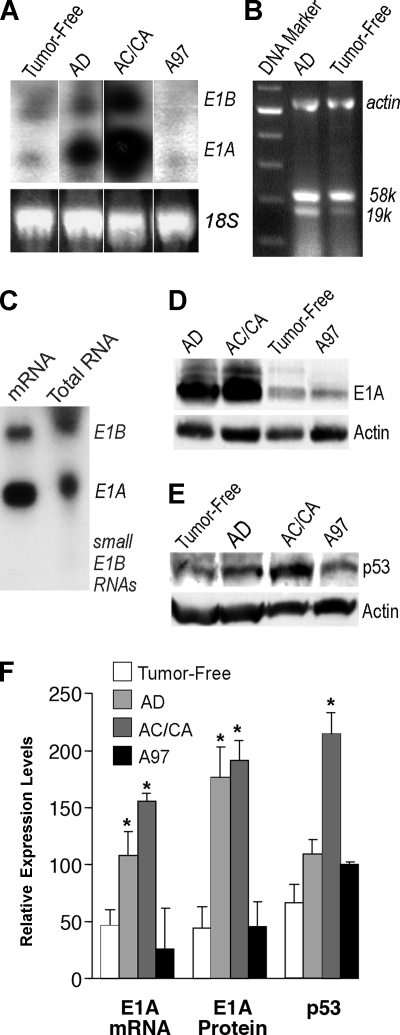
Analysis of aberrant expression of E1A, E1B, and p53 in the lungs with tumors. Higher levels of E1A transcript in the lung with tumors (A and C) as analyzed by Northern blotting. Note the tumor-free lung; AD, adenomatous lung; AC/CA, adenocarcinomatous lung or lung with carcinoma lung mixed with adenoma in Ad5 E1A+E1B transgenic mice; A97, Ad5 E1A transgenic mouse lung. The amount of total RNA loaded in each lane was quantified and controlled by mouse 18S rRNA in panel A. (B) Both the large transcript of E1B 58-kDa protein and the small transcript of E1B 19-kDa protein were analyzed for dominant expression by RT-PCR using RNase-free DNase-treated total RNA from lungs with adenomas or tumor-free lungs of Ad5 E1A+E1B transgenic mice. (C) mRNA was purified from the total RNA, which was prepared from four Ad5 E1A+E1B transgenic mouse lungs with adenoma or adenocarcinoma tumors. (D) Higher levels of E1A 243-aa protein in the lungs with tumors detected by Western blotting. (E) Higher levels of p53 in the lung with malignant tumors detected by Western blotting. The same lungs were used in panels B to E. (F) Comparative quantitation of transgene E1A transcript, E1A 243-aa protein, and p53 protein in the E1A+E1B transgenic tumor-free lungs, adenomatous lungs, lungs with adenocarcinoma or carcinoma mixed with adenoma, and A97 E1A transgenic mouse lungs, respectively. Columns, means (n = 2 or 3); error bars, standard deviations; *, P < 0.05 versus E1A+E1B transgenic tumor-free lungs.

