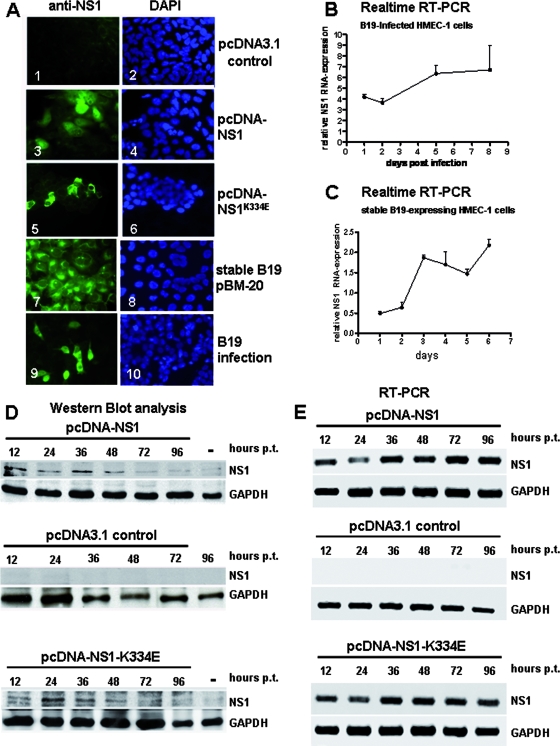
FIG. 1.
Expression of NS1 in HMEC-1. (A) Immunofluorescence experiments demonstrating NS1 protein expression of transfected HMEC-1 cells with pcDNA-NS1 (panel 3), mutant NS1K334E (panel 5), stable B19 pBM-20 HMEC-1 cells (panel 7), and B19-infected cells (panel 9). The NS1 protein was detected with monoclonal anti-NS1 antibodies 48 h after transfection. Corresponding images of DAPI (4′,6-diamidino-2-phenylindole) staining are shown in blue (panels 2, 4, 6, 8, and 10). pcDNA3.1 control transfection showed no NS1-specific staining (panel 1). (B) Real-time RT-PCR analysis of NS1 mRNA expression demonstrated a time-dependent increase in NS1 mRNA after B19 infection of HMEC-1 cells. (C) Stable B19-expressing HMEC-1 cells showed increased NS1 mRNA expression by real-time RT-PCR. (D) Western blot analyses demonstrating correct expression of NS1 polypeptides (71 kDa). HMEC-1 cells were transfected with pcDNA-NS1 (top panel), control constructs pcDNA3.1 (middle panel), and mutant pcDNA-NS1K334E (bottom panel), and harvested 12, 24, 36, 48, 72, and 96 h posttransfection (p.t.). Cell lysates of the transfected HMEC-1 cells were applied to 7.5% sodium dodecyl sulfate-PAGE, transferred to PVDF membranes, and probed with monoclonal anti-NS1 antibodies. pcDNA3.1 control transfectants showed no NS1-specific signals. The housekeeping gene GAPDH served as an internal control for the equal loading of proteins. Mock-transfected cells harvested 36 h after transfection were used as negative controls (−). (E) RT-PCR analyses showing B19 NS1 mRNA expression in HMEC-1 cells. HMEC-1 cells were transfected with pcDNA-NS1 (top panel), pcDNA3.1 control constructs (middle panel), and mutant pcDNA-NS1K334E (bottom panel). Total RNA was extracted 12, 24, 36, 48, 72, and 96 h posttransfection (p.t.) and subjected to RT-PCR analyses using gene-specific primers for B19 NS1. GAPDH-specific primers were used to demonstrate correct RNA synthesis. NS1- and GAPDH-specific mRNA amplicons were separated on 2% agarose gel electrophoreses and visualized by ethidium bromide staining.

