FIG. 2.
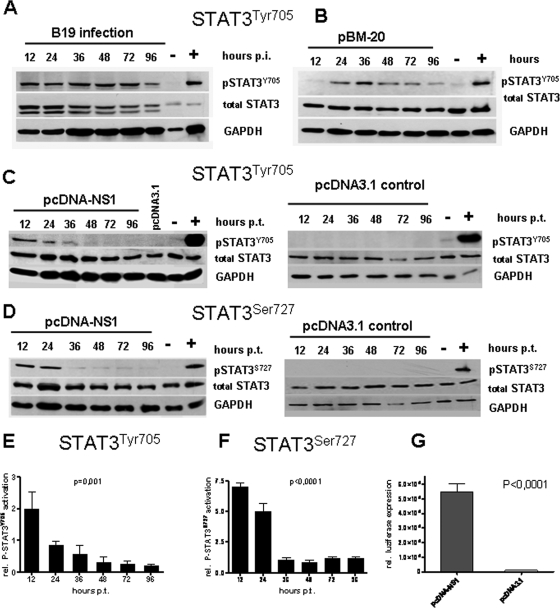
Expression of NS1 leads to activation of p-STAT3 in HMEC-1 cells. Western blot analyses of STAT3 activation by phosphorylation of STAT3Tyr705 (A to C) and STAT3Ser727 (D) in HMEC-1 cells at indicated time points after B19 infection (A), stable B19 expression (B), and transfection of NS1 (C and D). Corresponding pcDNA3.1 controls not expressing NS1 are shown (C and D, right panels). IL-6-stimulated HMEC-1 cells served as positive controls (+), and mock-transfected HMEC-1 cells served as negative controls (−) for STAT3 activation. Notably, the expression level of total STAT3 was not altered by NS1 (middle lanes). The housekeeping gene GAPDH showed that an equal amount of protein was loaded in each lane (A to D, bottom lanes). (E to F) Densitometric evaluation of STAT3 activation. The data represent a minimum of five independent experiments (P = 0.001 for STAT3Tyr705 [left panel]; P < 0.0001 for STATSer727 [right panel]). (G) Luciferase assays demonstrating P-STAT3 binding to the STAT3-specific CIE by NS1 expression 24 h after transfection of pcDNA-NS1 and the pcDNA3.1 control construct, respectively. The statistical analysis (E to F) was performed using a one-way analysis of variance and Tukey's multiple comparison posttest.

