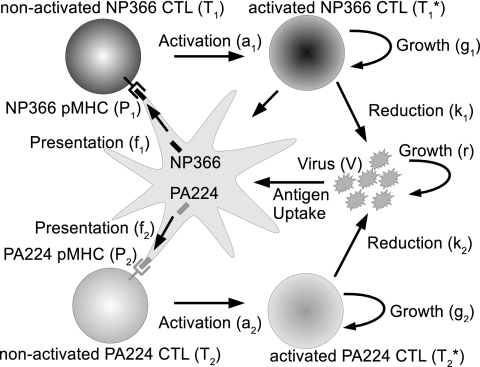
FIG. 2.
Schematic of the model. Virus grows initially at rate r and is later reduced through killing of infected cells by activated CTL. Epitope-specific pMHC on activated DC, Pi, are created in proportion to the virus load at rates f1 and f2 for the NP366 and PA224 epitopes, respectively. Unactivated CTL, Ti, are activated by their cognate epitope at rates ai. Activated CD8 T cells,  , proliferate at rates gi and reduce virus at rates ki. Equations and more details are given in the text.

