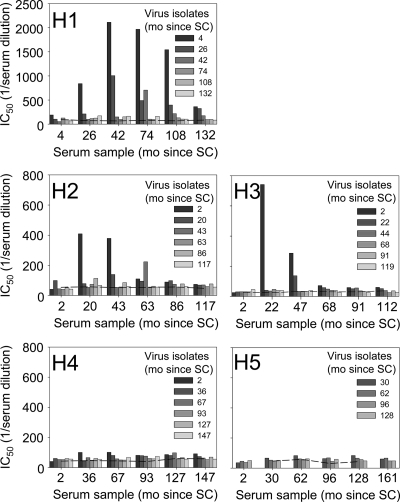
FIG. 2.
Development of autologous humoral immune responses. Average IC50s, determined by linear regression, of ≤5 virus variants per time point are indicated. Bars with identical shading represent inhibition of virus isolates from one time point by sera from different time points (as indicated on the x axis). The dashed lines represent background measurements using pooled sera from uninfected individuals. Note that the maximum value on the y axis in the graph for patient H1 is higher than the others. mo, months.

