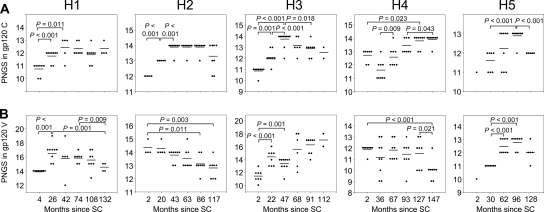
FIG. 4.
Longitudinal analysis of changes in the number of PNGS in the constant and variable regions of gp120. Each dot in the graphs indicates the characteristics of one clonal virus variant. The horizontal bars indicate the averages per time point. P values were calculated using a t test for independent samples. (A) Number of PNGS in the constant regions of gp120. (B) Number of PNGS in the variable regions of gp120.

