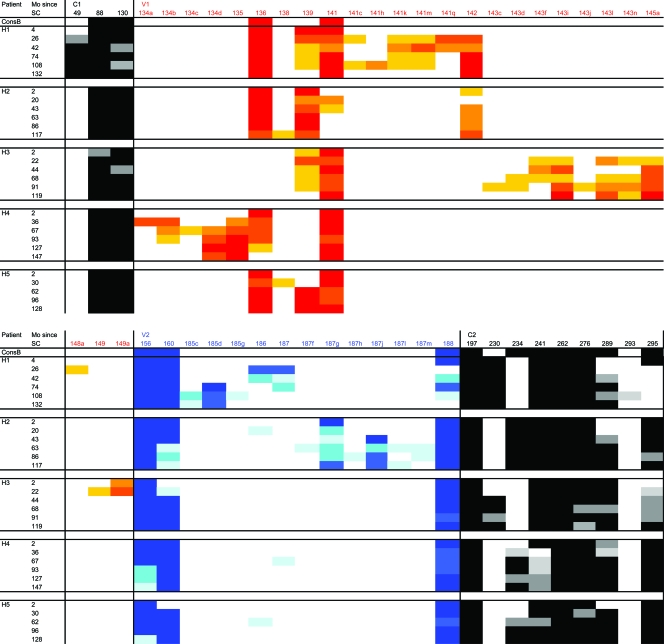
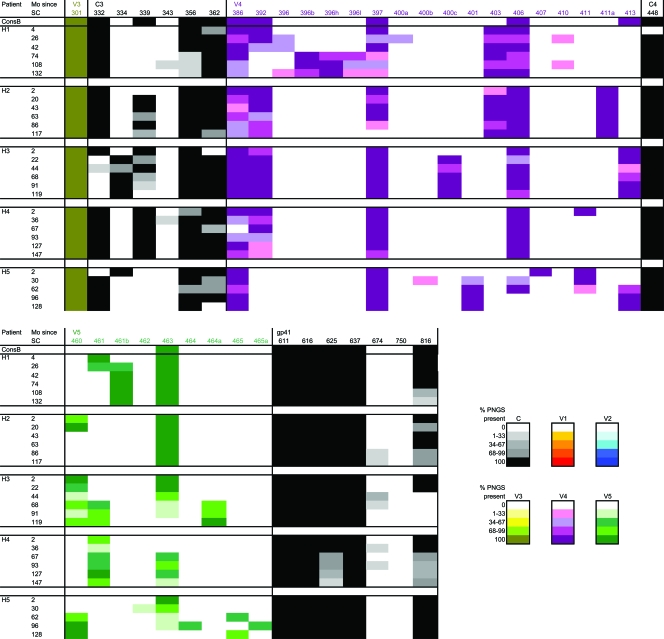
FIG. 5.
Changes in the locations of PNGS in gp160 sequences over the course of infection. The percentage of viruses with a PNGS at a given position per patient per time point is color coded using increasingly darker shades of gray for the constant regions of gp120 and gp41 and increasingly darker shades of red, blue, yellow, purple, and green for the V1, V2, V3, V4, and V5 regions, respectively. Mo, months.


