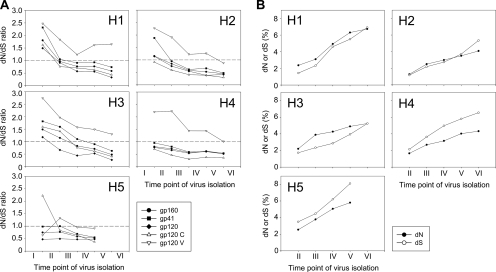
FIG. 6.
dN and dS rates in env during the course of infection. (A) Selection pressure on Env, expressed as the ratio between dN and dS. Ratios are shown for full-length gp160, gp41, and gp120 and constant regions and variable regions of gp120 between viruses from successive time points. The dashed lines indicate a dN/dS ratio of 1.0. dN/dS ratios of >1.0 are indicative of positive selection. (B) Divergence of dN and dS over the course of infection relative to the virus population present shortly after SC (time point I in panel A). For all patients, time point V corresponds to the moment of clinical AIDS diagnosis.

