
Figure 4.
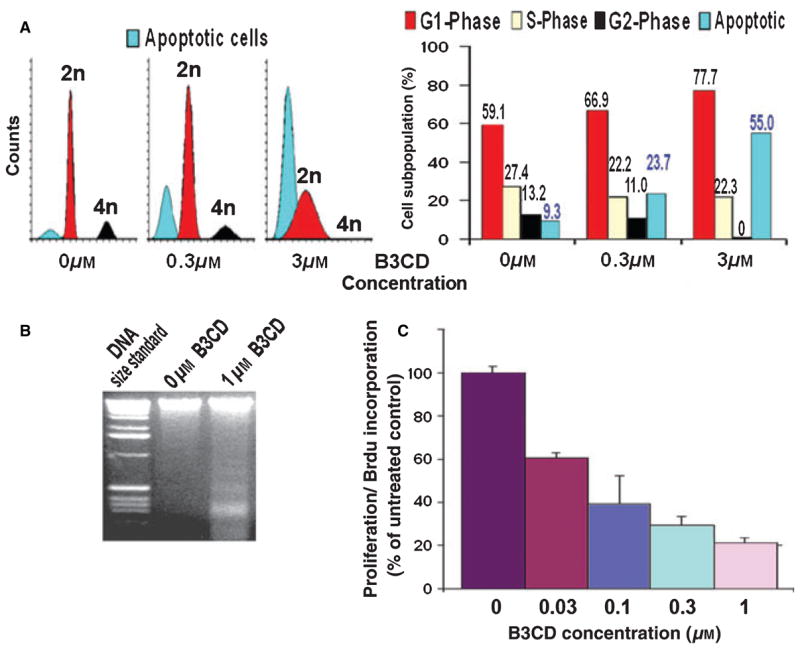
B3CD effect on SMS-KCNR NB cell proliferation and cell cycle progression. (A) Cell cycle analysis by FACS: NB cells were treated with 300 nM or 3.0 μM B3CD for 48 h. Cell cycle analysis by FACS of treated and untreated cells followed was carried out as described in ‘Materials and Methods’ section. Data are presented as the relative fluorescence intensity of cell sub-populations in the two-dimensional FACS profile (left panel) or bar diagram (right panel). (B) DNA fragmentation: NB cells were treated with 1 μM B3CD for 24 h. DNA fragmentation assay was carried out and apoptotic DNA fragment ladder (n ×123 bp) detected as described in ‘Materials and Methods’ section. (C) BrdU incorporation: NB cells were treated with various concentrations (30 nM to 3.0 μM) of B3CD for 24 h. The proliferation assay was carried out as described in ‘Materials and Methods’ section. Experiments were performed in triplicates; data are expressed as the mean of the triplicate determinations (X SD) in % cell proliferation of untreated cells [100%].