
Figure 4. The 2B4-CD48 Binding Interface.
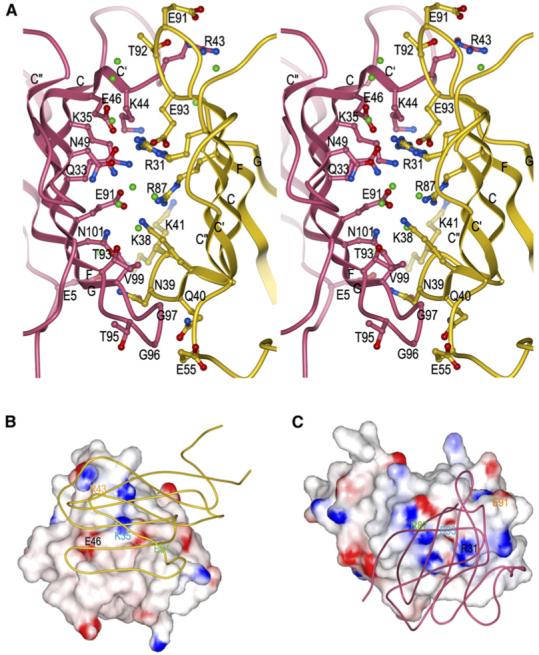
(A) Stereo view of residues that participate in hydrogen bond or salt bridge interactions at the 2B4/CD48 interface (Table 2). 2B4 is rose and CD48 is gold. The side chains of interacting residues are drawn in ball-and-stick representation, with carbon atoms in rose (2B4) or gold (CD48), nitrogen atoms in blue, and oxygen atoms in red. Bound waters mediating hydrogen bonds between 2B4 and CD48 are shown as green balls.
(B) Electrostatic potential surface of 2B4 viewed from the perspective of CD48 (tube diagram). The view of the complex in (B) is rotated ∼90° counterclockwise about the vertical axis compared to the view in (A). Solvent-accessible surfaces of 2B4 are colored according to electrostatic potential, with positively charged regions in blue and negatively charged regions in red. Electrostatic surface potentials were calculated with GRASP (Nicholls et al., 1991).
(C) Electrostatic potential surface of CD48 from the perspective of 2B4 (tube diagram). The view of the 2B4-CD48 complex in (C) is rotated 180° about the vertical axis with respect to the view in (B). Four selected pairs of charged residues (each pair labeled with a different color) that form salt bridges across the 2B4-CD48 interface are indicated on the surfaces, illustrating their matched charged potentials and relative positions on 2B4 (B) or CD48 (C).