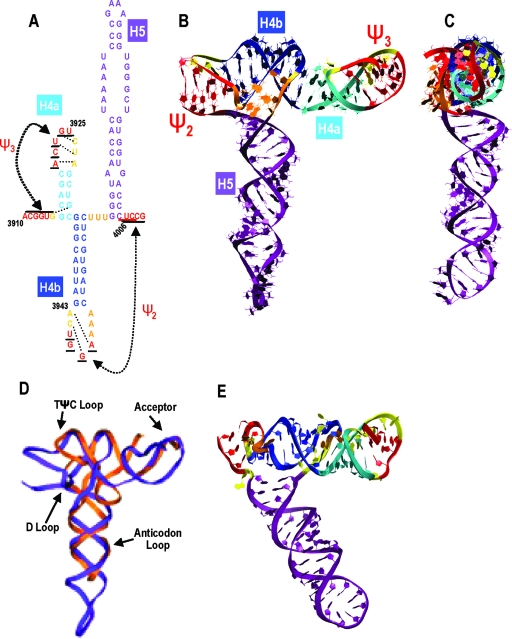
FIG. 4.
T-shaped structure predicted by RNA2D3D and molecular modeling. (A) Ψ3→Ψ2 region of TCV subjected to RNA2D3D and molecular modeling. The secondary structure of the TCV modeled region with predicted tertiary interactions is indicated by dotted lines. (B) Predicted tertiary structure of TCV colored according to the secondary structure shown in panel A. Ψ2 and Ψ3 are red, and unpaired bases are yellow. (C) Side view of the predicted TCV structure. (D) Superimposed structures of the TCV region between Ψ2 and Ψ3 (purple) and Phe-tRNA (orange). tRNA sites are indicated. (E) Predicted structure of CCFV region from Ψ2 through Ψ3.

