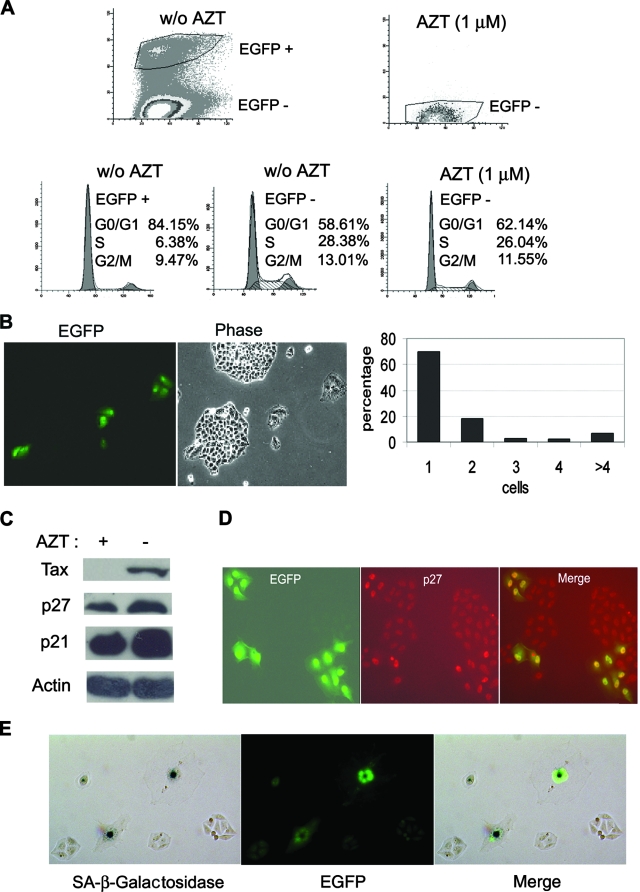
FIG. 3.
HTLV-1-infected HeLa cells become arrested in G1. (A) HTLV-1-infected HeLa cells are arrested in G1. Two days after coculture, HeLa cells were trypsinized, plated at a density of 1 × 10⁶ cells/10-cm plate, and grown for another 24 h. The cells were then harvested, fixed, and stained with propidium iodide for flow cytometry as detailed in Materials and Methods. Infected EGFP-positive (EGFP +) and uninfected EGFP-negative (EGFP −) cell populations in the AZT-free coculture (top left panel labeled w/o AZT [for without AZT]) were gated and further analyzed for cell cycle progression (two bottom left panels). The percentages of cells in the G0/G1, S, and G2/M phases of the cell cycle were computed using the ModFit LT software package. The uninfected EGFP-negative (EGFP −) cell population in the AZT-treated culture [AZT (1 μM), top right panel] was analyzed similarly (bottom right panel). (B) HTLV-1-infected HeLa cells cease proliferation. After removal of MT2 cells (see Materials and Methods), HeLa/18x21-EGFP cells that had been exposed to HTLV-1 were trysinized and plated as single cells on 10-cm plates on day 1 and grew for 6 days. Both infected (EGFP-positive) and uninfected (EGFP-negative) cells were then visualized using an Olympus IX81 fluorescence microscope. Individual EGFP-positive cells and cell clusters and the number of cells in each cluster were counted. The percentages of individual cells and cell clusters with cell number ranging from one to four and greater than four (>4) were plotted. (C) Increased expression of p21CIP1/WAF1 and p27KIP1 in HeLa cells cocultivated with MT2 cells. HeLa/18x21-EGFP-cells were cocultured with MT2 in the presence (+) or absence (−) of 1 μM AZT as described in the legend to panel A. Routinely, 5 to 6% of HeLa/18x21-EGFP cells were EGFP positive in the AZT-free culture. Cell lysates were prepared and immunoblotted with p21CIP1/WAF1, p27KIP1, Tax, and actin antibodies as described above. (D) Nuclear retention of p27KIP1 in HTLV-1-infected HeLa cells. HTLV-1 infection in HeLa cells was scored by EGFP expression (EGFP expression shown in green). The expression of p27KIP1 was detected by indirect immunofluorescence (in red) as described in Materials and Methods. The merged fluorescence image is displayed on the right. The correlation between EGFP and nuclear p27KIP1 signals is approximately 70%. (E) HTLV-1-infected HeLa cells expressed senescence-associated β-galactosidase (SA-β-Gal). HTLV-infected HeLa/18x21-EGFP cells were fixed and stained for SA-β-Gal activity using 5-bromo-4-chloro-3-indolyl-β-d-galactopyranoside (X-Gal) as a substrate (Materials and Methods). The hydrolysis of X-Gal by SA-β-Gal produced blue intracellular precipitates which appeared as dark spots in a bright-field black and white image (SA-β-galactosidase). HTLV-1 infection was indicated by EGFP expression. The two images were merged to show a direct correlation of infection and senescence.

