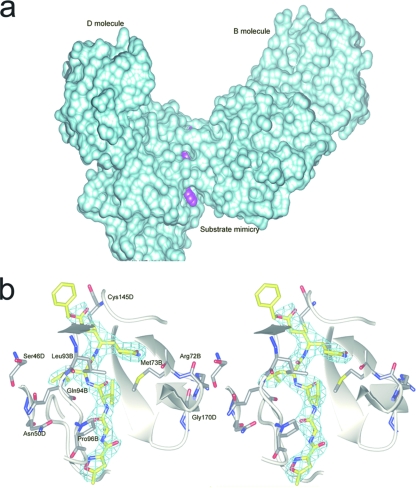
FIG. 4.
(a) Overview of the P3 pocket. The inhibitor resides between the interface of molecules B and D. A cyan surface model is shown covering protomers B and D. The inhibitor is shown in magenta. (b) P3 interaction site of substrate in detail. Neighboring residues within 4 Å of the S3 site are colored green. An Fo-Fc map contoured at 1.5σ around the inhibitor is displayed in cyan. For the inhibitor, C atoms are colored yellow, N atoms are colored blue, and O atoms are colored red. The protein carbon atoms are colored gray. Neighboring main chains are displayed as white ribbons.

