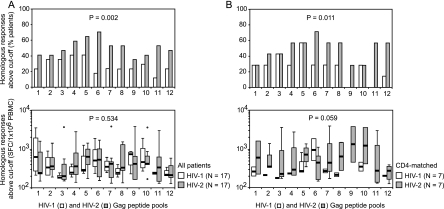
FIG. 3.
Homologous peptide pool responses in HIV-1 and HIV-2-infected patients. (A) All HIV-1- and HIV-2-infected patients. (B) HIV-1 and HIV-2-infected patients matched for CD4 counts. Top graphs show percentages of patients with responses above the cutoff value to the 12 consecutive HIV-1 and HIV-2 peptide pools. Bottom graphs show patient response levels above the cutoff value to the 12 consecutive HIV-1 and HIV-2 peptide pools. Box plots represent the lowest value, the 25th percentile, the 50th percentile (median), the 75th percentile, and the highest value, respectively. Outliers, defined as values smaller than the 25th percentile minus 1.5 times the IQR or larger than the 75th percentile plus 1.5 times the IQR, are represented by open circles. Differences in response frequencies (top graphs) and median response levels (bottom graphs) between HIV-1 and HIV-2-infected patients were analyzed for the 12 aligned peptide pool pairs with Wilcoxon signed-rank tests.

