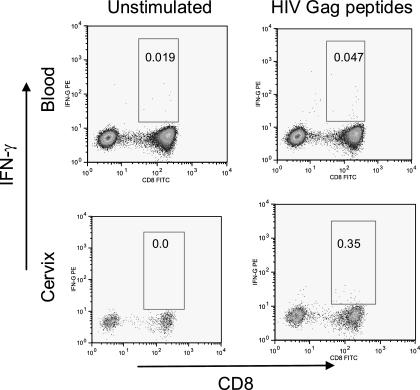
FIG. 2.
Representative plot showing ex vivo intracellular IFN-γ production by blood (top panels)- and cervical mucosa (bottom panels)-derived CD8+ CD3+ cells in response to HIV Gag. Mononuclear cells were either not stimulated (left panels) or stimulated ex vivo with a single pool of HIV-1 subtype C Gag peptides (right panels). Events were acquired by using a BD FACSCaliber flow cytometer; compensation and analysis were performed by using FlowJo software.

