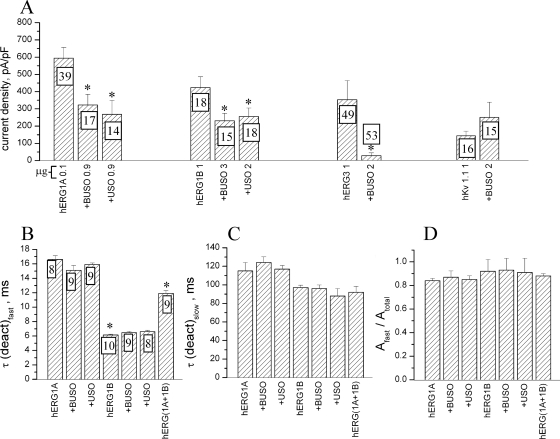
FIG. 3.
Biophysical properties of currents obtained in herg1a- and herg1b-transfected HEK 293 cells. The effects of cotransfection with USO-containing cDNAs are shown. The voltage clamp protocols used in all the experiments shown in this figure are described in Materials and Methods. (A) Average maximal current density, recorded at −120 mV from HEK 293 cells, transfected with the different herg1a, herg1b, herg3, and Kv1.1 cDNAs as controls plus herg1USO (+USO) or herg1bUSO (+BUSO). The numbers in the columns indicate the numbers of recorded cells. The numbers on the x axis after the transfected cDNA indicate the amount (in micrograms) of the different cDNAs used to transfect the cells. Values that are significantly different (P < 0.05, two-tailed t test) in the controls (cells transfected with a single cDNA) and cells cotransfected with one USO-containing cDNA are indicated by an asterisk. (B to D) Fast (B) and slow (C) time constants of deactivation (deact) kinetics and the ratio of the fast time constant to the total amplitude (D) measured under control conditions and under USO-containing cDNA cotransfection. The numbers in the columns indicate the numbers of recorded cells. Values that are significantly different (P < 0.05, two-tailed t test) in the controls and cells transfected with the USO-containing cDNAs are indicated by an asterisk.

