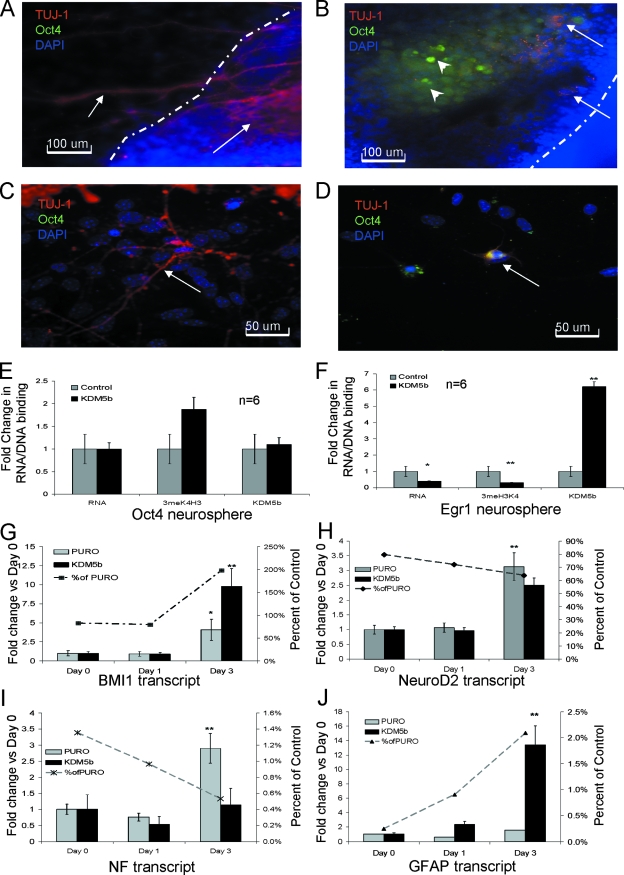
FIG. 3.
Terminal neural differentiation is blocked by constitutive KDM5b expression. (A) Day 5 neurospheres from control mESCs adhered to the dish. The dashed line shows the edge of the neurosphere. Arrows denote TUJ-1-positive cells. (B) Neurospheres from mESCsKDM5b. Dashed line shows the edge of the neurosphere. Arrows denote TUJc-positive cells; arrowheads denote Oct4-positive cells. (C) Day 7 neurospheres from control mESCs. Arrow shows TUJ-1-positive cell. (D) Day 7 neurospheres from mESCs KDM5b. Arrow shows TUJ-1/Oct4 double-positive cell. For panels A, B, C, and D, blue is DAPI, red is TUJ-1, and green is Oct4. (E and F) qRT-PCR and svChIP for Oct4 and Egr1 for day 3 neurospheres from control (mESCPURO and mESCs) and mESCKDM5b showing transcript, 3meH3K4 binding or KDM5b binding (primers are listed in Table S1 and S2 in the supplemental material). (G, H, I and J) qRT-PCR of BMI1, NeuroD2, NF, and GFAP transcript during neurosphere formation. Bar graph and left y axis show the change value for each day with respect to day 0 value. Line graph and right y axis denote the percentage value for NSKDM5b compared to that for NSPURO on the same day. *, P = 0.05; **, P < 0.01. All data are in triplicate except where noted.

