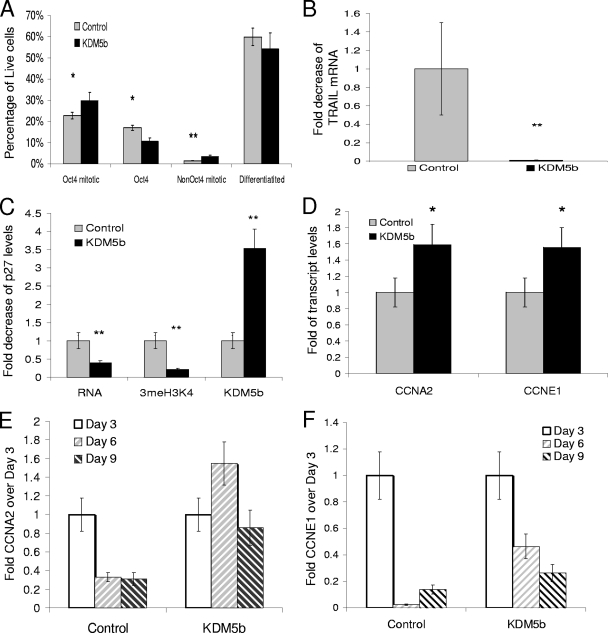
FIG. 5.
EBKDM5b display increased proliferation through increased expression of cyclin A2 and E1. (A) Graph of flow cytometry results showing the percentage of all live cells that stained with either anti-Oct4 primary/Alexa 488 secondary and/or anti-P-H3/Alexa647 secondary; “Differentiated” represents all live cells that were not stained by either antibody in either control (EB and EBPURO) or EBKDM5b at day 9. (B) Expression of TRAIL mRNA in day 9 EBs, either control (normal EBs) or EBKDM5b at day 9. (C) qRT-PCR and svChIP for p27 for day 9 EBs from control (mESCs) and mESCKDM5b of transcript, 3meH3K4 binding, or KDM5b binding. (D) qRT-PCR of cyclin A2 and cyclin E1 transcript from day 9 EBs (primers are listed in Table S1 in the supplemental material). (E and F) Comparison of qRT-PCR for cyclin A2 and cyclin E1 resulting from the EB assay. The baseline value is the amount of transcript in day 3 EBs. *, P = 0.05; **, P < 0.01. All data in triplicate except where noted.

