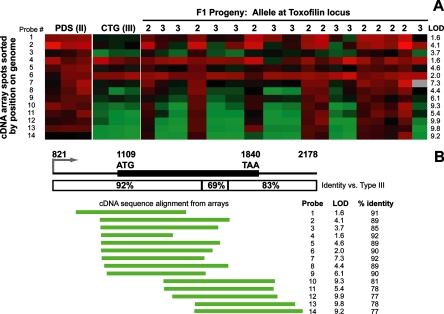
FIG. 2.
Microarray analysis of strain-specific differences at the toxofilin locus. (A) Microarray data from the 14 toxofilin probes from the bradyzoite microarray derived from a type II strain. Parasite cDNA was labeled with Cy5 (red) and cohybridized with a Cy3-labeled common reference. Data are shown from triplicate arrays for the type II and type III parents, and single arrays were done for each of the 18 F1 progeny. LOD scores as determined by R/QTL software are shown for each probe. (B) Structure of the toxofilin locus. The putative promoter and predicted N-terminal region of the protein are more conserved between type II and type III than the predicted C terminus and putative 3′ UTR. The locations of the 5′ ends of the cDNAs on the microarray are shown below the locus, sorted by the start position on the genome. The percentage of identity between the sequenced portion of the probe and the type III toxofilin sequence, along with the LOD score for each probe, is also shown, demonstrating the inverse correlation between the percentage of identity and the LOD score.

