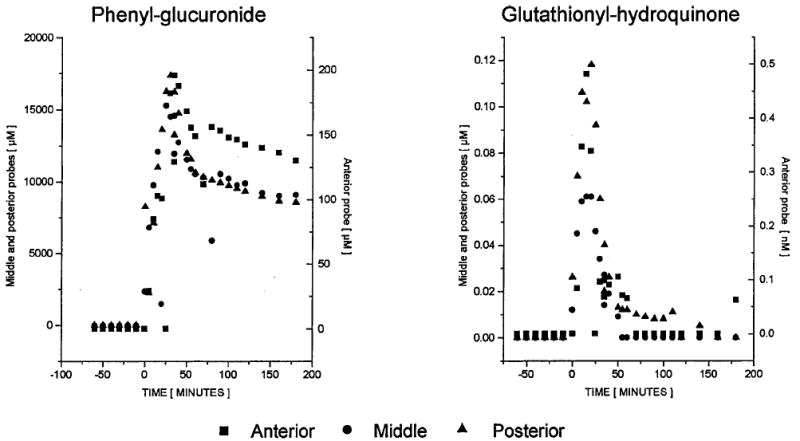
Figure 10.

Typical concentration–time course for phenyl-glucuronide (left) and glutathionyl-hydroquinone (right) during and after a 20-min iv infusion of phenol (administration corresponding to 0–20 min). Note: scale for the anterior probe is the right-hand axis.37
