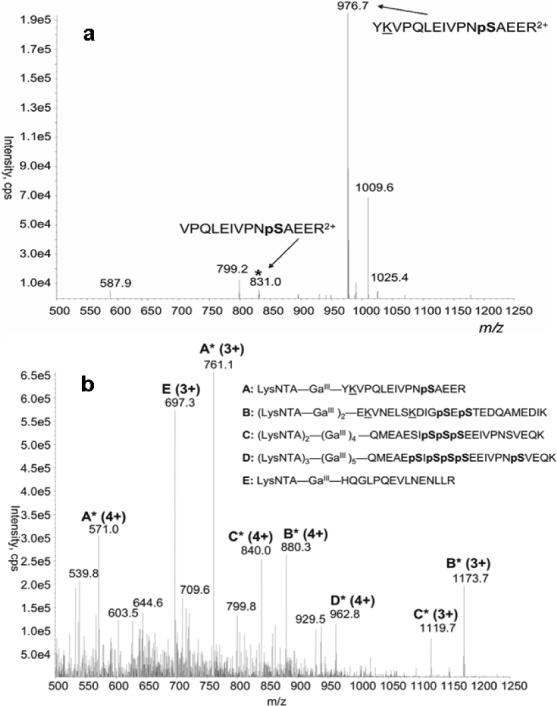
Figure 5.

Top spectrum: (a) Neutral scan (49 Da difference) of a phosphopeptide mixture from trypsinolysis of α-casein at 400 nM. Bottom spectrum: (b) Precursor scan or the m/z 263 common fragment ion from LysNTA-GaIII complexes of the same peptide mixture.
