
Figure 5. Apparent association of V1 and V2 fragments, measured by FRET.
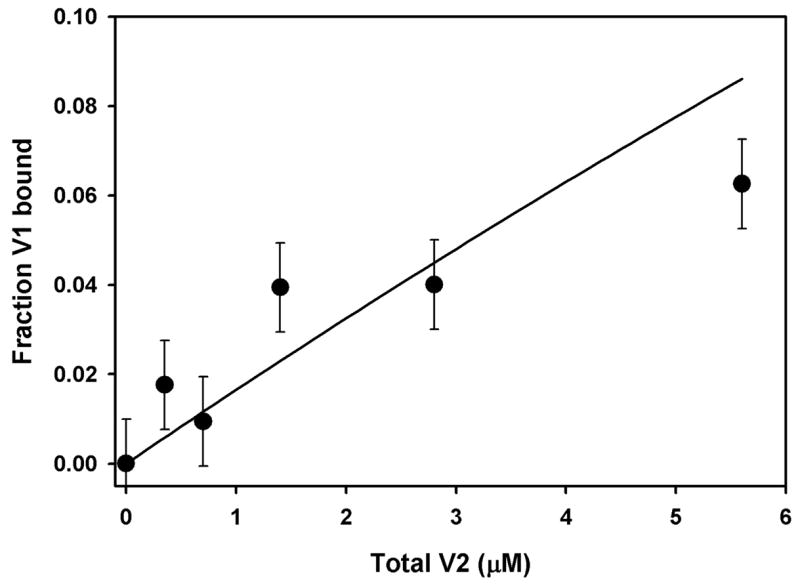
V1-V2 association data from magnitude of sensitized emission at 285 nm, analyzed as described in text. Line calculated from eq. (1) with association constant = 0.017 μM−1. Error bars indicate standard deviation from line. Conditions, 0.7 μM V1, 0.55% CHAPS, 0.55% DMPC, 0.15% SDS, 0.05 M phosphate, pH 6.0.