
Figure 6. Helix-helix interactions in seven-transmembrane-helix proteins.
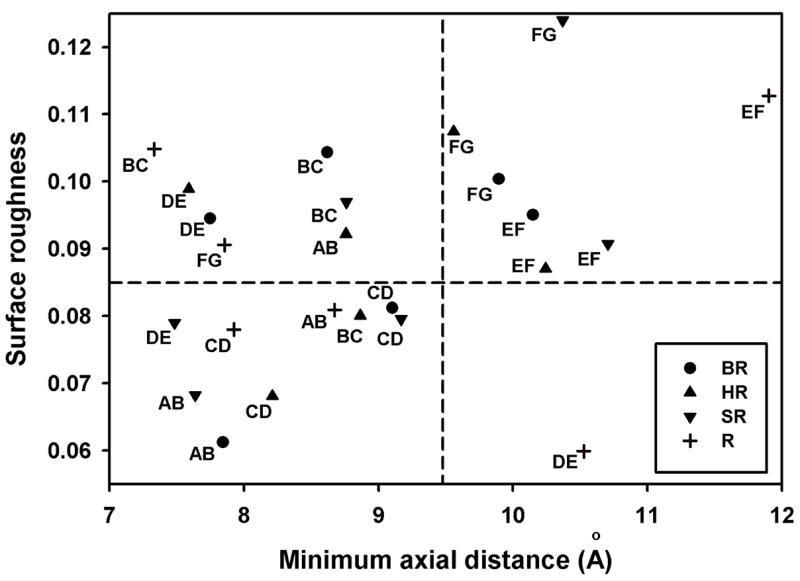
Distance of closest approach of helix pairs obtained from helix axes by averaging Cα atomic coordinates in contiguous groups of 4 and then calculating minimum axial distance. Surface roughness calculated from fractal dimension, D (17) and plotted as D - 2. Protein Data Bank files: circles, BR, 1C3W; triangles, HR (halorhodopsin), 1E12; inverse triangles, SR (sensory rhodopsin II), 1JGJ; crosses, R (bovine rhodopsin), 1F88. Letters next to symbols indicate helix pairs, starting from the N-terminal helix (A) to the C-terminal helix (G).