
Fig. 1.
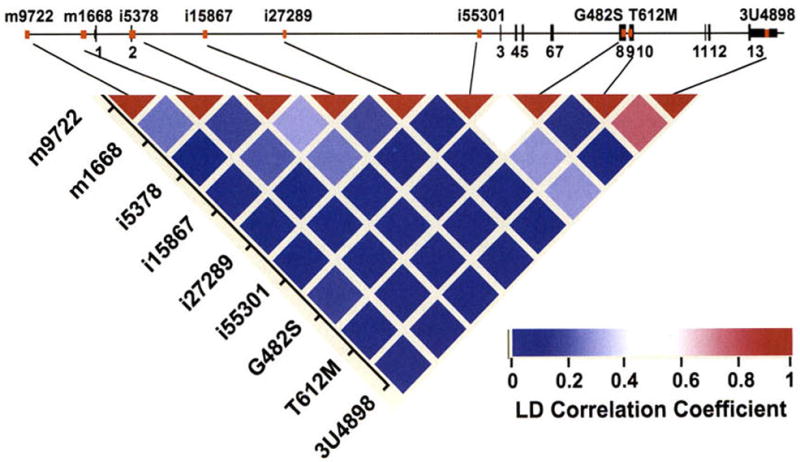
PPARGC1A (or PGC-1α) genomic structure and pairwise linkage disequilibrium estimation. Top: Exon/intron organization of the 120-kb genomic region of PPARGC1A. The 13 exons are numbered and represented by black bars. Commonly studied SNPs of PPARGC1A, including those described in this study, are represented by red bars. Bottom: Pairwise linkage disequilibrium was estimated as the correlation coefficient (r2), the strength of which is indicated by the color scale: red, absolute linkage disequilibrium; white, intermediate; and blue, lack of any linkage.