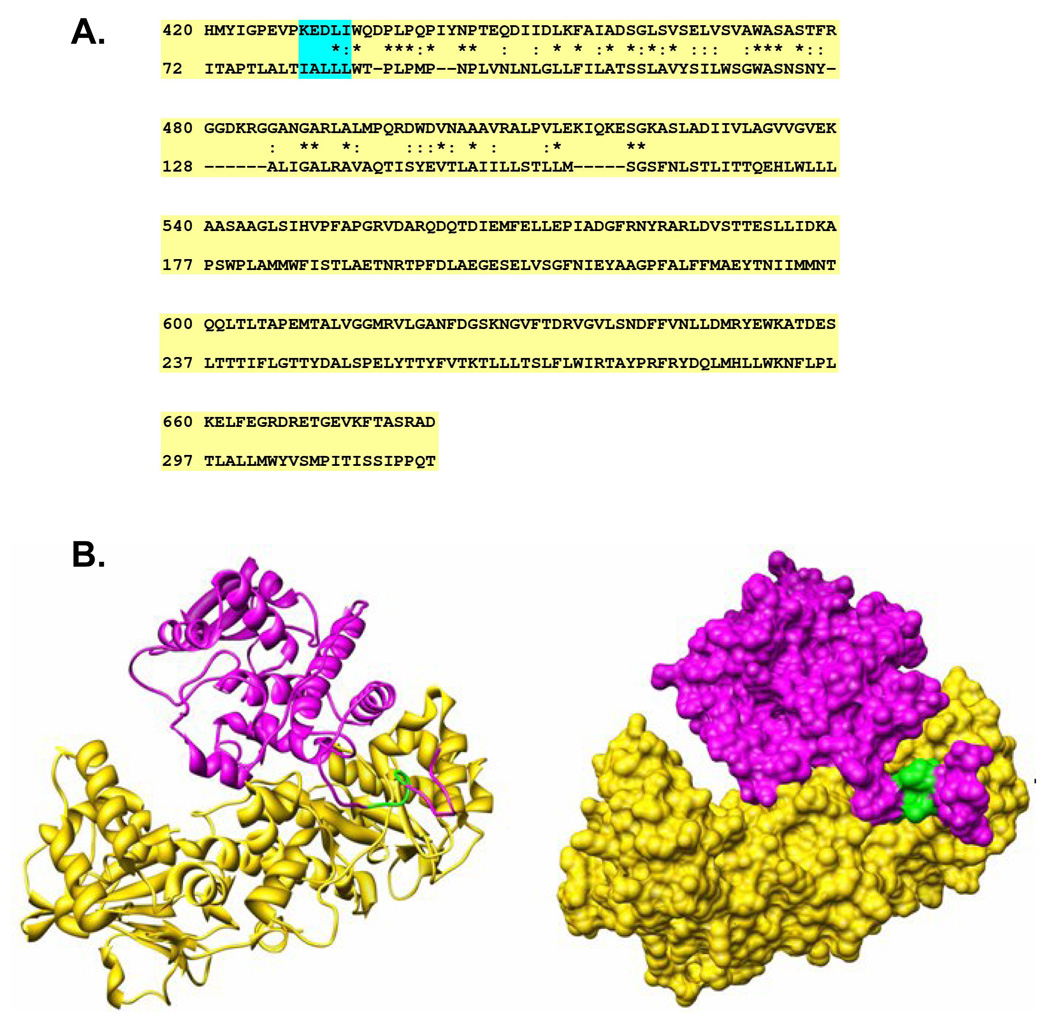
Figure 4. The interacting modeling between PBEF and ND1.

A. The sequence alignment between human NADH dehydrogenase subunit 1 (ND1) and the catalase-peroxidase KatG (pdb code: 1U2L). The sequence alignment was performed using the FASTA program (13). For each alignment row, the upper line is the sequence of 1U2L and the lower line is that of human ND1. The “*” symbols represent identical amino acid residues. The “:” symbols show residue pairs with positive matrix scores, representing similar sequence alignment according to the FASTA algorithm. B. The interacting mode between the PBEF and ND1. The left panel is a ribbon representation. The right panel shows the molecular surface of the same proteins. PBEF is shown in gold, and ND1 is in magenta. The green part represents residues 81–85 of ND1. This figure was prepared using the UCSF Chimera (34, 35)
