
Figure 5.
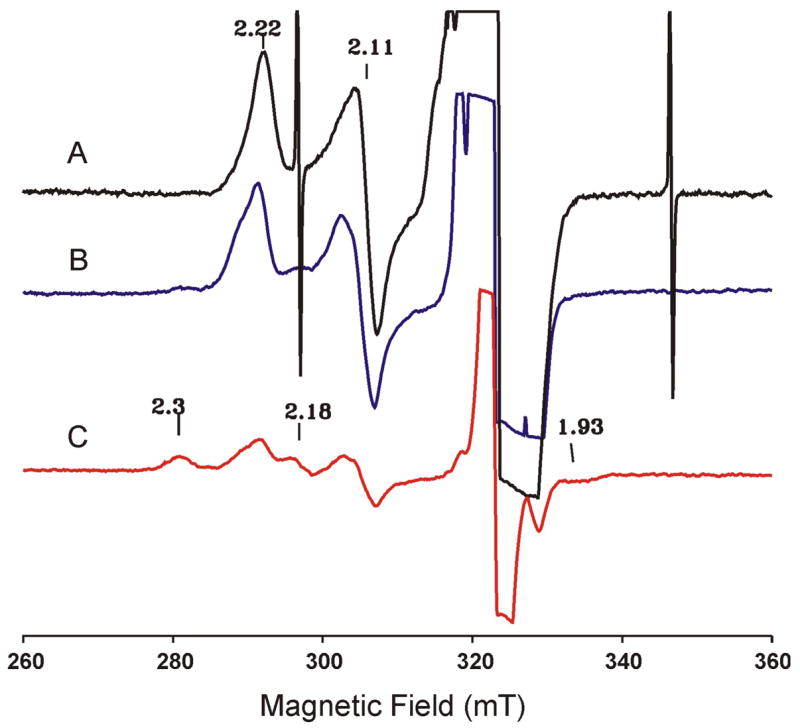
EPR spectra of cryoreduced oxy Mb (A). (B) and (C) are spectra of this same sample after annealing at 180 K and 190 K, respectively. The spectra are recorded at 77 K, 9.10 GHz, 10 mW microwave power, 100 kHz modulation frequency and 0.5 mT modulation amplitude.