
Figure 7.
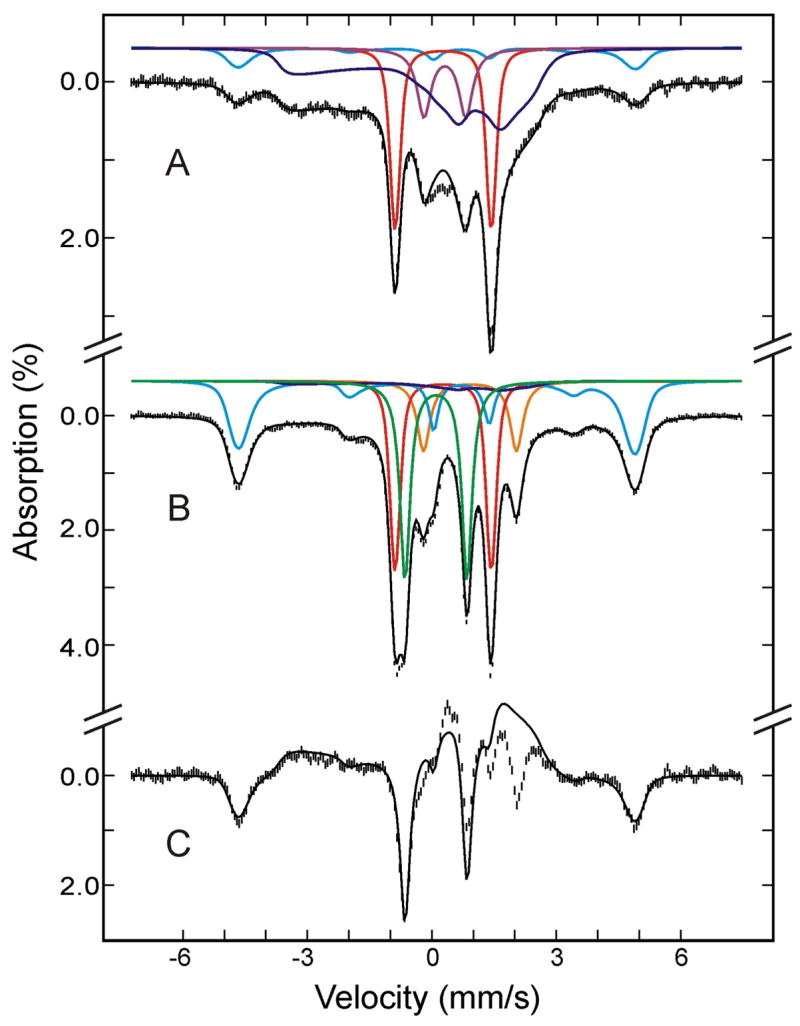
Mössbauer spectra of the cryoreduced oxygenated HO sample after annealing at 180 K (A) and at 195 K (B). The data (hatched marks) were recorded at 4.2 K in a parallel applied field of 50 mT. The theoretical spectra of each individual species are shown as color lines above the experimental spectra ((FeII-O2)Mb, red; high-spin FeIII Mb, cyan in A; (FeIII-O2 2−)Mb, blue; low-spin FeII Mb, purple; (FeIV=O2−)Mb, green; deoxy FeII Mb, orange; the cyan line in B is the sum of (FeIII-H2O)Mb and FeIII Mb product.), and the composite spectra are shown as black solid lines overlaid with the experimental spectra. A difference spectrum of B minus A is shown in C (hatched marks). The black solid line in C is the theoretical difference spectrum of (FeIV=O2−)Mb plus FeIII Mb product minus (FeIII-O22−)Mb.